Chapter 2: Flectra web framework
In the previous chapter, we learned to use Owl framework and its different concepts. We can now learn how to use the Flectra JavaScript framework which is is built on top of Owl.

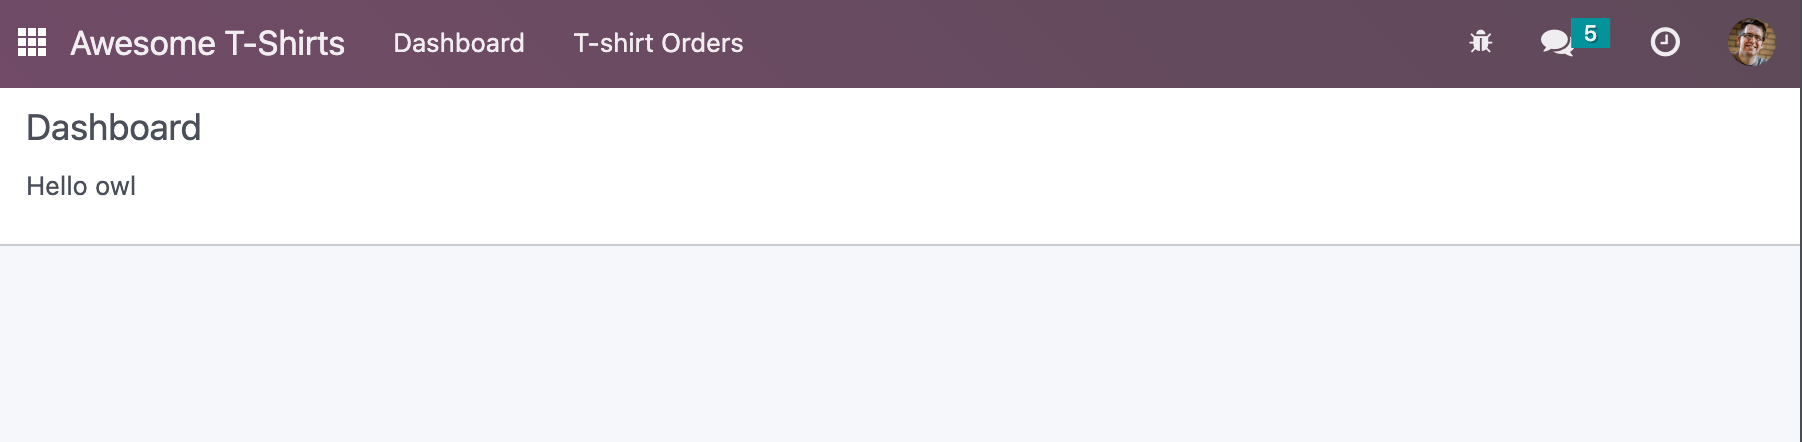
This is the progress that we have made in discovering the JavaScript web framework at the end of Chapter 1: Components.
In the awesome_tshirt module, we will build our Awesome dashboard. This will be a good
opportunity to discover many useful features in the Flectra JavaScript framework.
Goal
The solutions for each exercise of the chapter are hosted on the official Flectra tutorials repository.
1. A new Layout
Most screens in the Flectra web client uses a common layout: a control panel on top, with some buttons,
and a main content zone just below. This is done using a Layout component, available in @web/search/layout.
Exercise
Update the AwesomeDashboard component located in awesome_tshirt/static/src/ to use the
Layout component. You can use { "top-right": false, "bottom-right": false } for the
display props of the Layout component.
2. Add some buttons for quick navigation
Bafien Carpink want buttons for easy access to common views in Flectra. In order to do that, you will need to use the action service.
Services is a notion defined by the Flectra JavaScript framework, it is a
persistent piece of code that exports state and/or functions. Each service can depend on other
services, and components can import a service with the useService() hooks.
Example
This shows how to open the settings view from a component using the action service.
import { useService } from "@web/core/utils/hooks";
...
setup() {
    this.action = useService("action");
}
openSettings() {
    this.action.doAction("base_setup.action_general_configuration");
}
...
Exercise
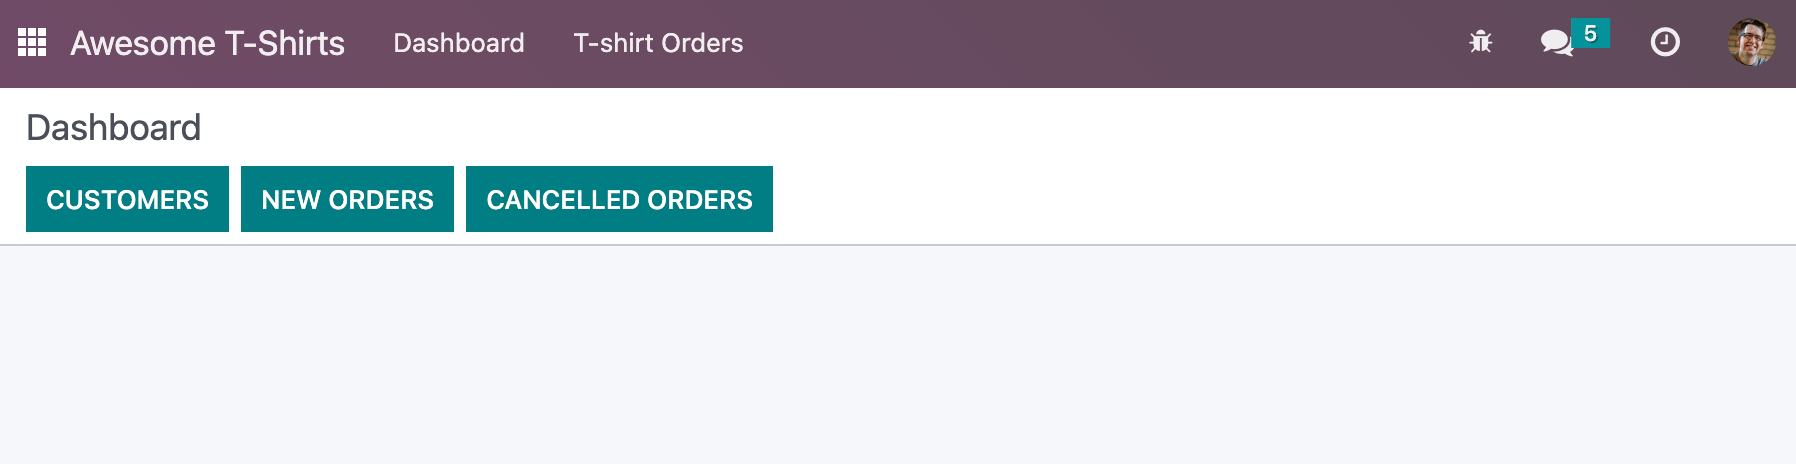
Let us add three buttons in the control panel bottom left zone.
A button
Customers, which opens a kanban view with all customers (this action already exists, so you should use its xml id).A button
New Orders, which opens a list view with all orders created in the last 7 days.A button
Cancelled Order, which opens a list of all orders created in the last 7 days, but already cancelled.
3. Call the server, add some statistics
Let’s improve the dashboard by adding a few cards (see the Card component made in the Owl
training) containing a few statistics. There is a route /awesome_tshirt/statistics that will
perform some computations and return an object containing some useful information.
Whenever we need to call a specific controller, we need to use the rpc service. It only exports a single function that perform the request:
rpc(route, params, settings)
Here is a short explanation on the various arguments:
routeis the target route, as a string. For example/myroute/.paramsis an object that contains all data that will be given to the controller. (optional)settingsare for advanced controls on the request. Make it silent, or using a specific xhr instance. (optional)
Example
A basic request could look like this:
setup() {
    this.rpc = useService("rpc");
    onWillStart(async () => {
        const result = await this.rpc("/my/controller", {a: 1, b: 2});
        // ...
    });
}
Exercise
Change
Dashboardso that it uses therpcservice.Call the statistics route
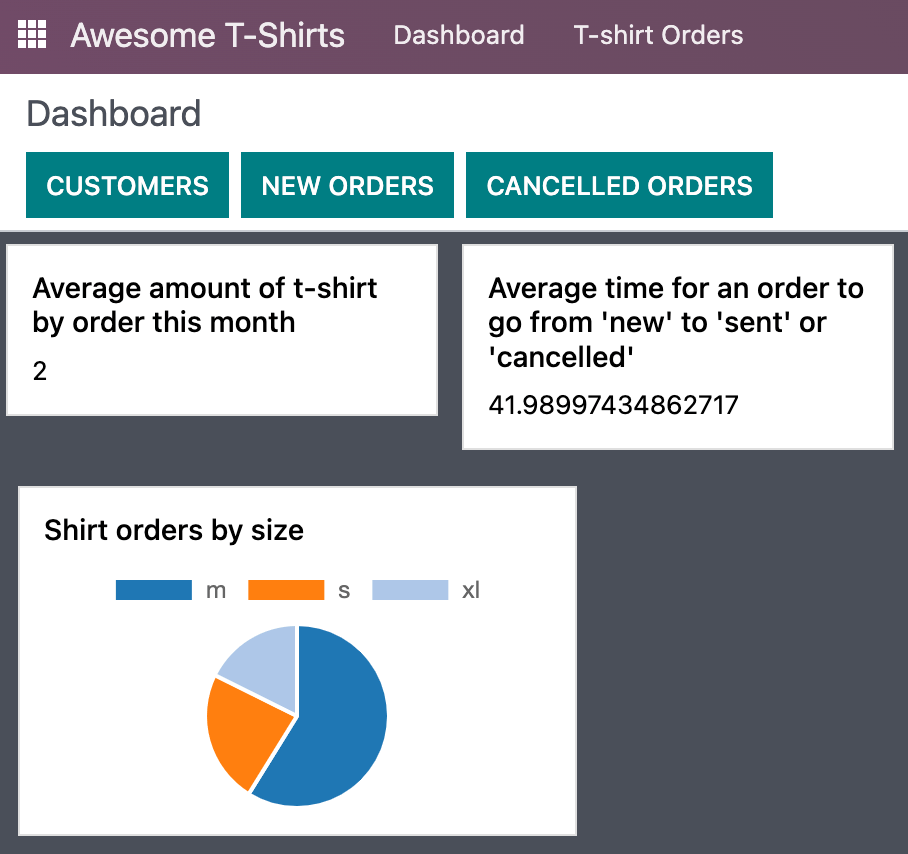
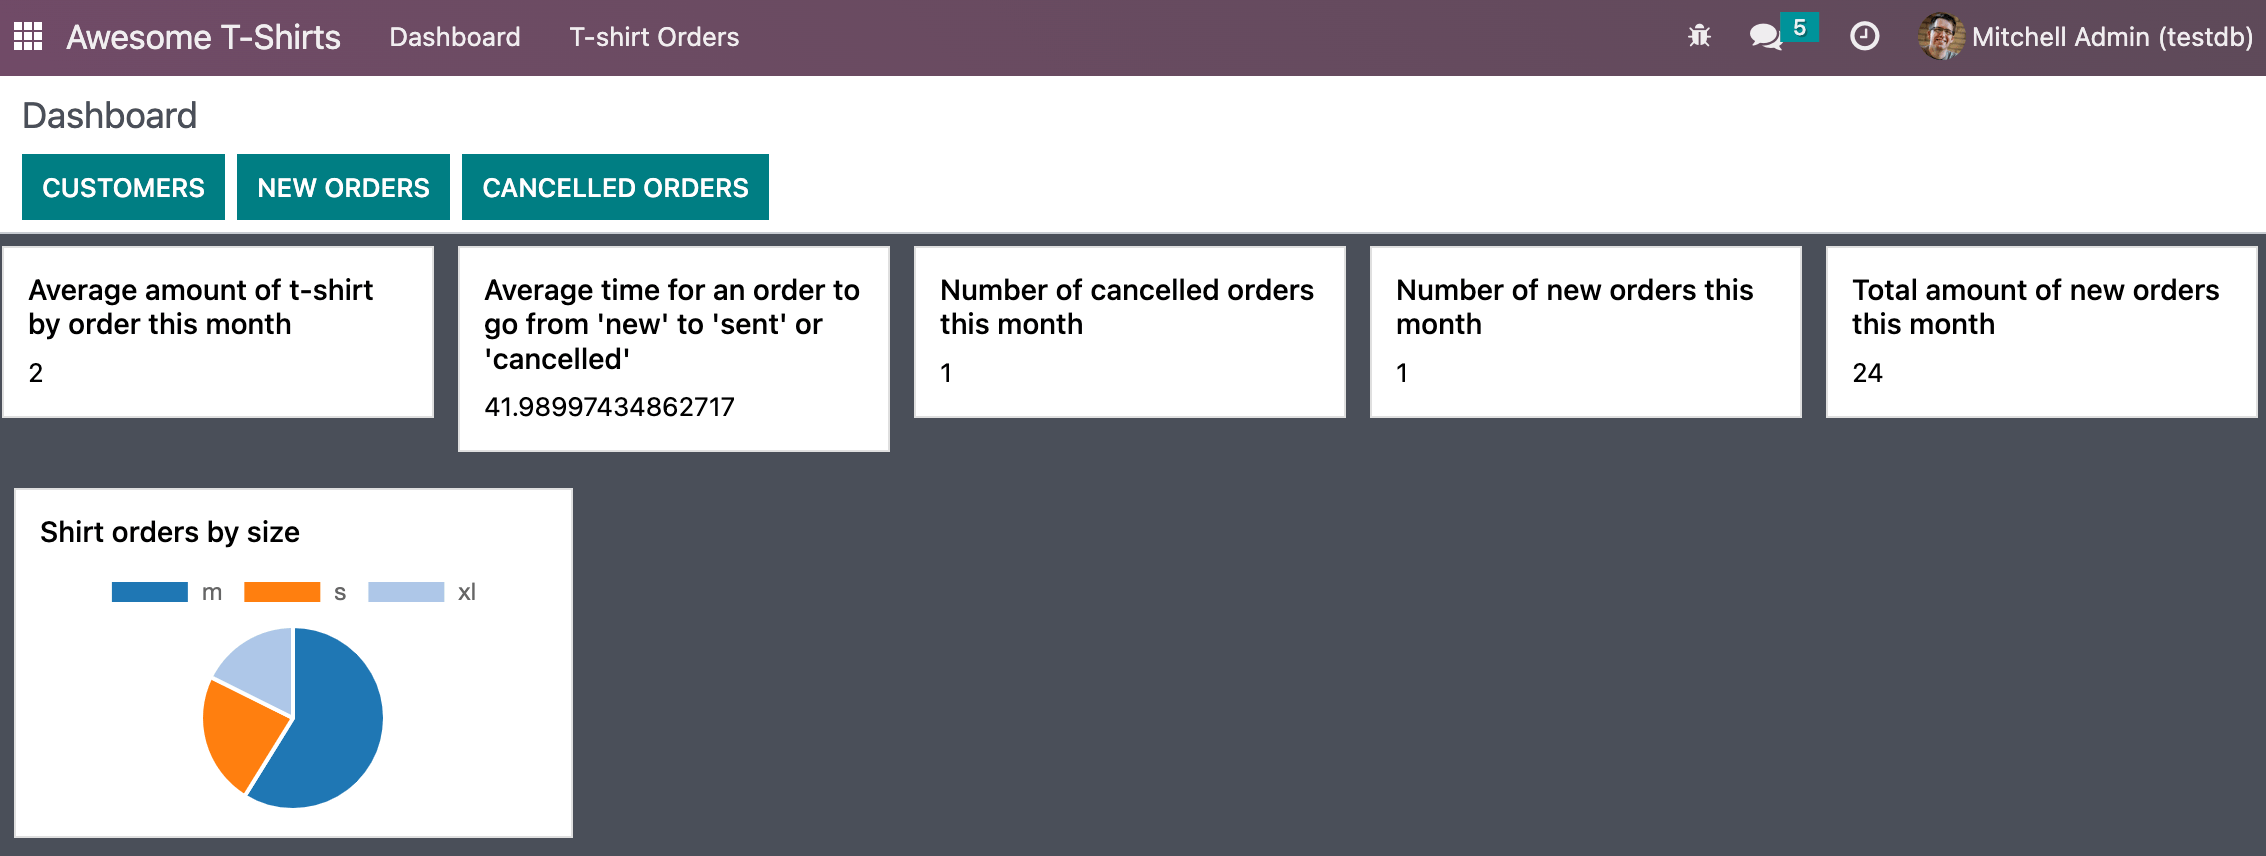
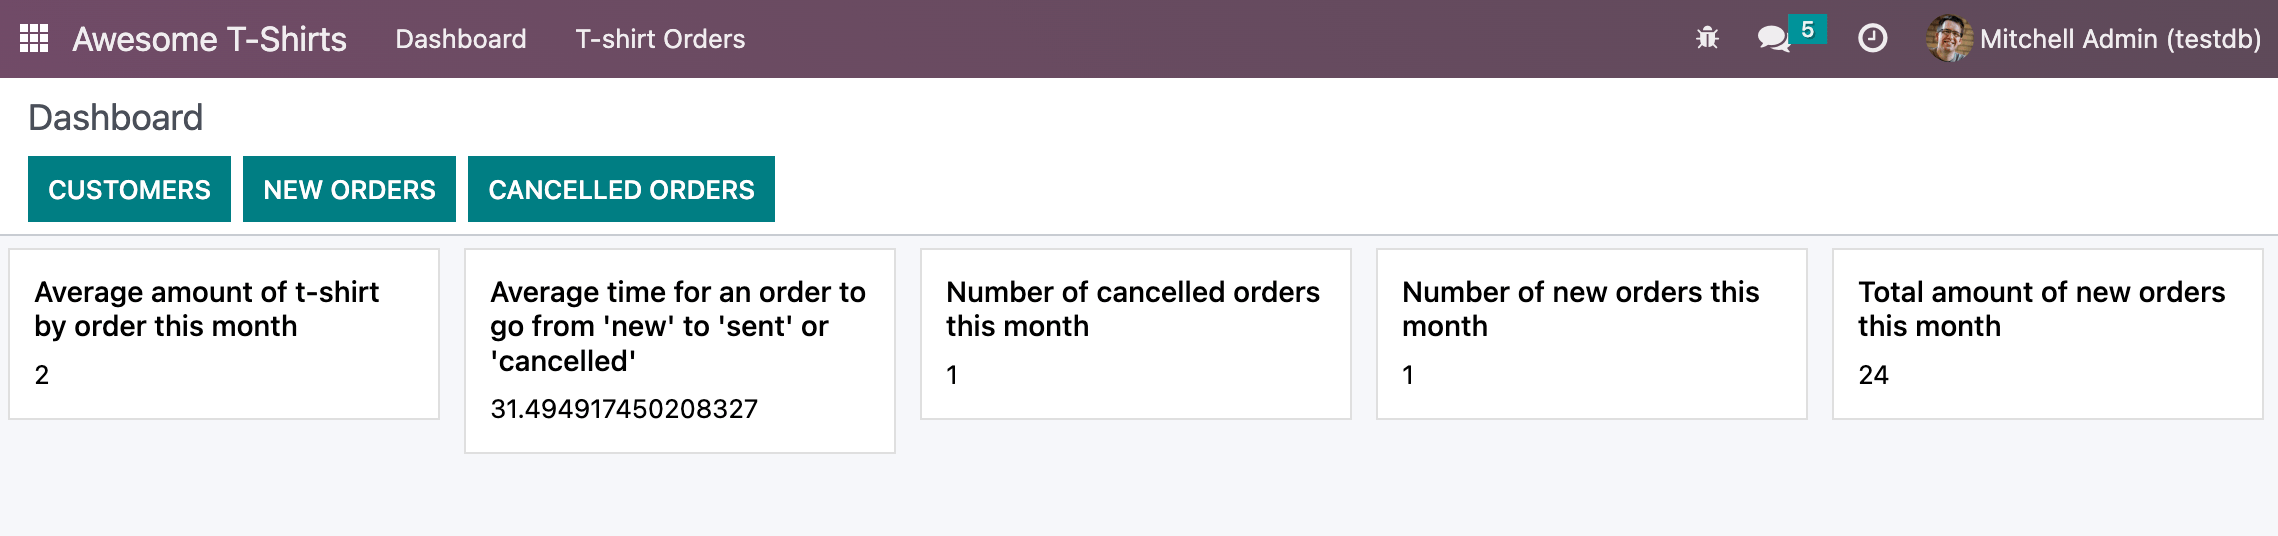
/awesome_tshirt/statisticsin theonWillStarthook.Display a few cards in the dashboard containing:
Number of new orders this month
Total amount of new orders this month
Average amount of t-shirt by order this month
Number of cancelled orders this month
Average time for an order to go from ‘new’ to ‘sent’ or ‘cancelled’
4. Cache network calls, create a service
If you open your browser dev tools, in the network tabs, you will probably see that the call to
/awesome_tshirt/statistics is done every time the client action is displayed. This is because the
onWillStart hook is called each time the Dashboard component is mounted. But in this case, we
would probably prefer to do it only the first time, so we actually need to maintain some state
outside of the Dashboard component. This is a nice use case for a service!
Example
The following example registers a simple service that displays a notification every 5 seconds.
import { registry } from "@web/core/registry";
const myService = {
    dependencies: ["notification"],
    start(env, { notification }) {
        let counter = 1;
        setInterval(() => {
            notification.add(`Tick Tock ${counter++}`);
        }, 5000);
    },
};
registry.category("services").add("myService", myService);
Exercise
Implements a new
awesome_tshirt.statisticsservice.It should provide a function
loadStatisticsthat, once called, performs the actual rpc, and always return the same information.Maybe use the memoize utility function from
@web/core/utils/functionsUse this service in the
Dashboardcomponent.Check that it works as expected
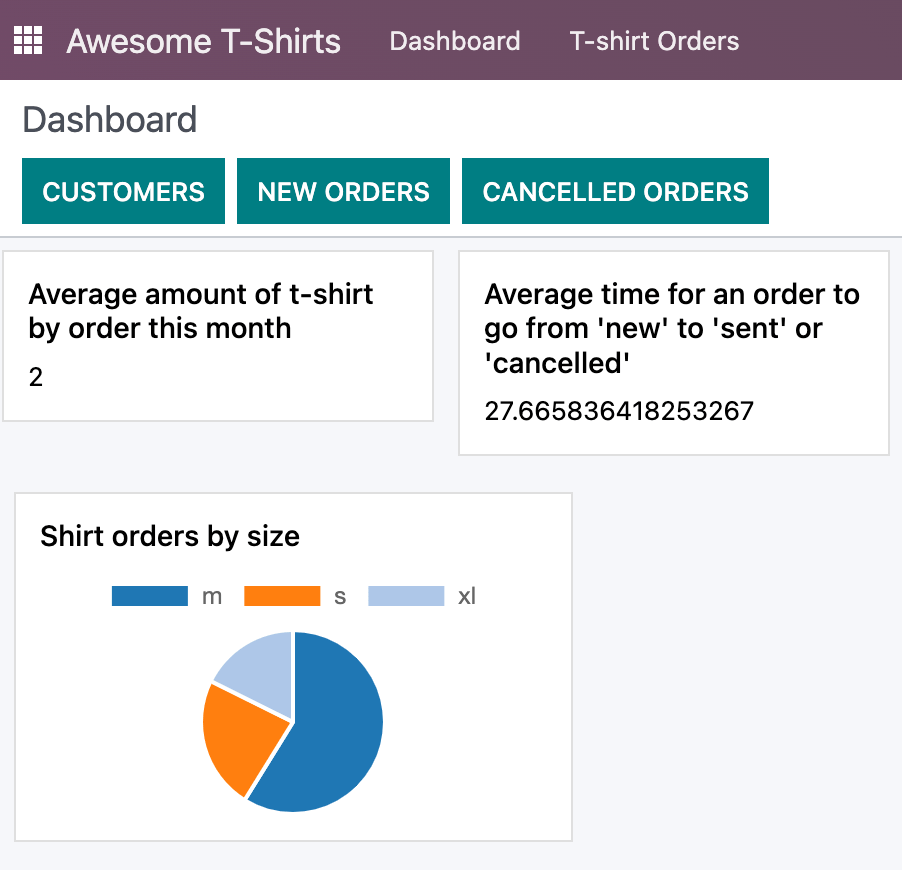
5. Display a pie chart
Everyone likes charts (!), so let us add a pie chart in our dashboard, which displays the proportions of t-shirts sold for each size: S/M/L/XL/XXL.
For this exercise, we will use Chart.js. It is the chart library used by the graph view. However, it is not loaded by default, so we will need to either add it to our assets bundle, or lazy load it (it’s usually better since our users will not have to load the chartjs code every time if they don’t need it).
Exercise
6. Going further
Here is a list of some small improvements you could try to do if you have the time:
Exercise
Make sure your application can be translated (with
env._t).Clicking on a section of the pie chart should open a list view of all orders which have the corresponding size.
Add a SCSS file and see if you can change the background color of the dashboard action.