Reports for a Better Support
An efficient customer service solution should have a built-in reporting option. Reports allow you to track trends, identify areas for improvement, manage employees’ workloads and, most importantly, meet your customer’s expectations.
Cases
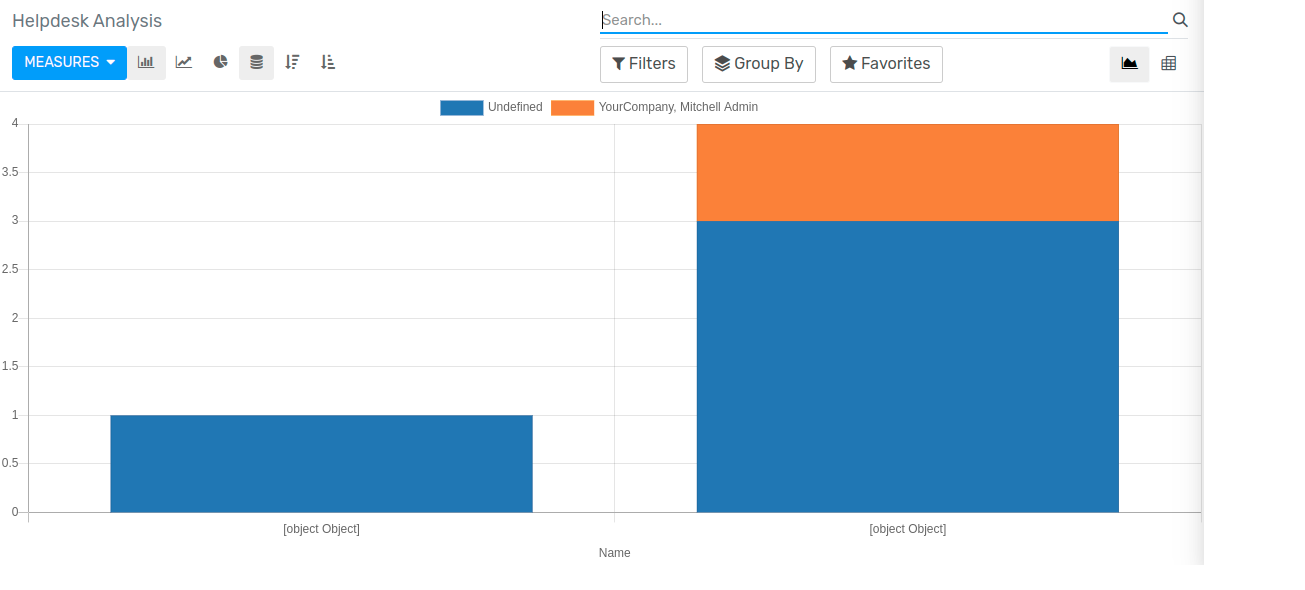
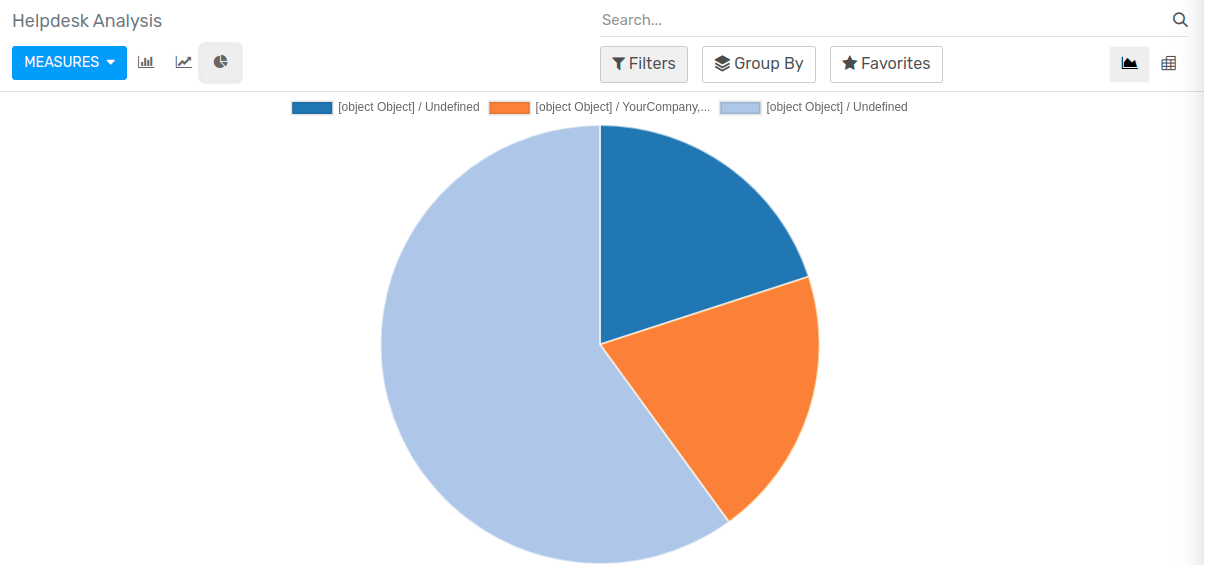
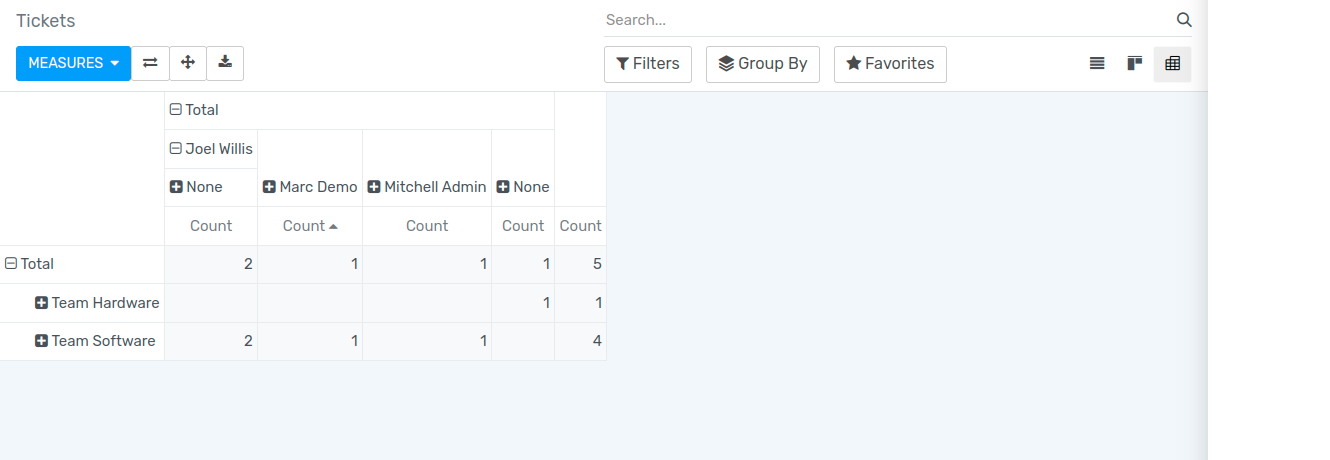
Some examples of the reports Flectra Helpdesk can generate include:
The number of tickets grouped by team and ticket type.

The number of tickets closed per day, per team.
Get an overview of how many requests each team is closing per day in order to measure their performance. Identify productivity levels to understand how many requests they are able to handle.

Tip
Filter it by Assignee to see Key Performance Indicators (KPI) per agent.
The number of hours tickets are taking to be solved, grouped by team and ticket type.
Check if your expectations are met by measuring the Time to close (hours). Your customers not only expect fast responses but they also want their issues to be handled quickly.

Save filters
Save the filters you use the most and avoid having to reconstruct them every time they are needed. To do so, set the groups, filters, and measures needed. Then, go to Favorites.

See also