Activate the Developer (Debug) Mode
The Developer or Debug Mode gives you access to extra and advanced tools.
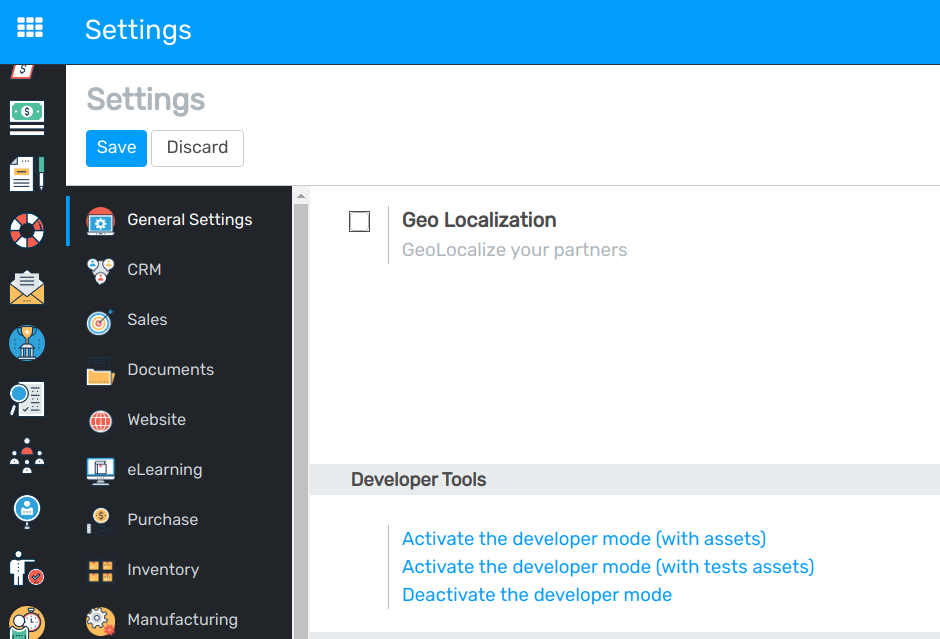
Through the Settings application
Go to .
Note
Activate the developer mode (with assets) is used by developers; Activate the developer mode (with tests assets) is used by developers and testers.
Once activated, the Deactivate the developer mode option becomes available.
Through a browser extension
Go to the settings and extensions of your web browser, and search for Flectra Debug. Once the
extension is installed, a new icon will be shown on your toolbar.
For the Flectra Debug extension, a single click enables a normal version of the mode, while a
double click enables it with assets. To deactivate it, use a single click.

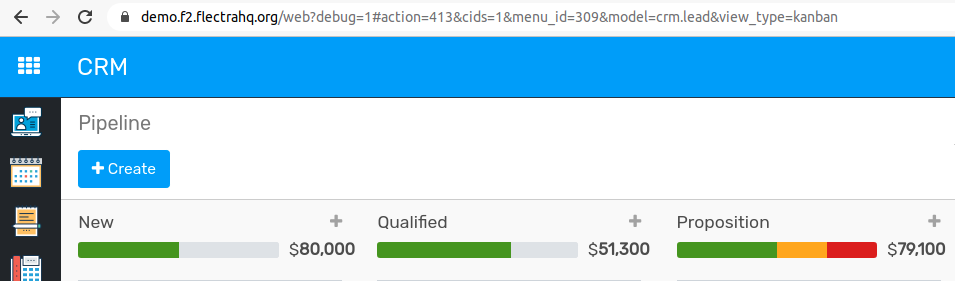
Through the URL
In the URL add ?debug=1 or ?debug=true after web.
Tip
Developers: type ?debug=assets and activate the mode with assets.
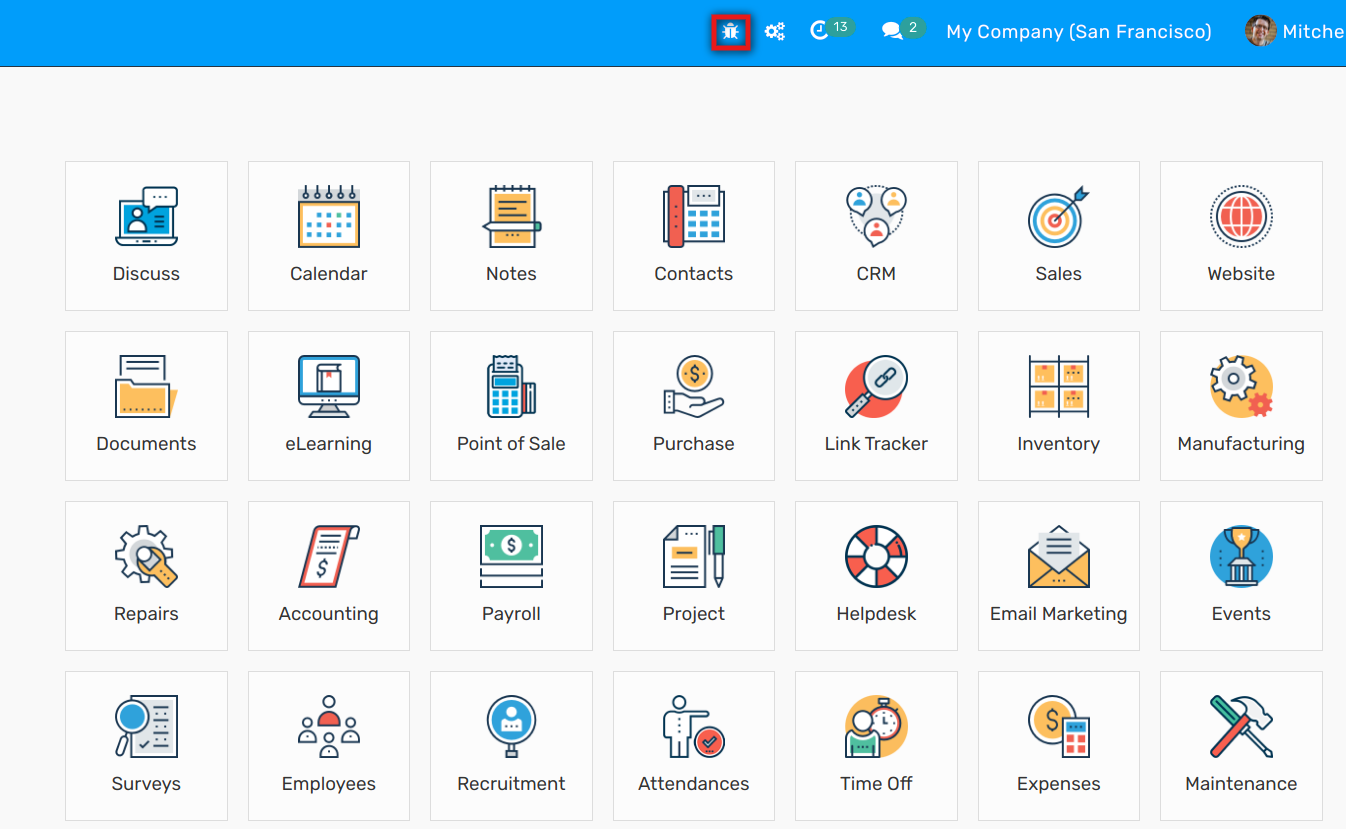
Locate the mode tools
The Developer mode tools can be accessed from the Open Developer Tools button, located on the header of your pages.